UI/UX & Graphic Design · SaaS
Veridian Analytics
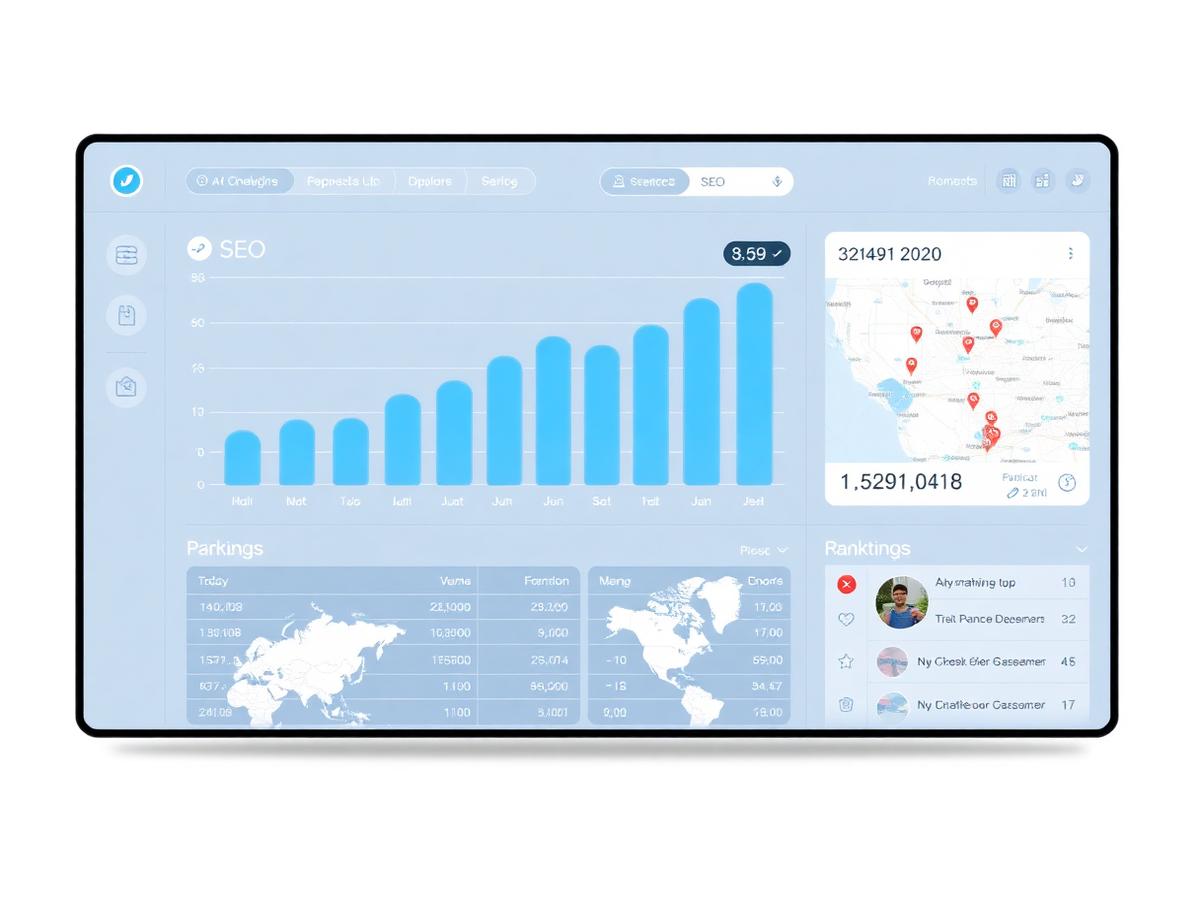
Dashboard and admin design for a data platform with dense tables and complex filters.
Year: 2025Duration: 7 weeksServices: Software Design
The challenge
Power users could do everything in the product but needed training to find anything, and support load kept growing.
Our approach
- Task analysis with three user roles to prioritise screens
- Table, filter and chart patterns standardised into tokens
- Progressive disclosure for advanced settings
- Empty, loading and error states designed, not improvised
Results
-44%
Support tickets on navigation
-2 days
Onboarding time per user
1 system
Across web and admin
Technologies
- Figma
- Data viz
- Design tokens